Structure Visualization
Hint
Author: Xinwei Zhang
Proof: Yifan Feng (丰一帆)
Basic Usages
DHG provides a simple interface to visualize the correlation structures:
Create a structure object (i.e.,
dhg.Graph,dhg.BiGraph,dhg.DiGraph, anddhg.Hypergraph);Call the
draw()method of the object;Call
plt.show()to show the figure orplt.savefig()to save the figure.
Note
The plt is short for matplotlib.pyplot module.
Visualization of Graph

>>> import matplotlib.pyplot as plt
>>> from dhg.random import graph_Gnm
>>> g = graph_Gnm(10, 12)
>>> g.draw()
>>> plt.show()
Visualization of Directed Graph

>>> import matplotlib.pyplot as plt
>>> from dhg.random import digraph_Gnm
>>> g = digraph_Gnm(12, 18)
>>> g.draw()
>>> plt.show()
Visualization of Bipartite Graph

>>> import matplotlib.pyplot as plt
>>> from dhg.random import bigraph_Gnm
>>> g = bigraph_Gnm(30, 40, 20)
>>> g.draw()
>>> plt.show()
Visualization of Hypergraph

>>> import matplotlib.pyplot as plt
>>> from dhg.random import hypergraph_Gnm
>>> hg = hypergraph_Gnm(10, 8, method='low_order_first')
>>> hg.draw()
>>> plt.show()
Advanced Usages
Customize Labels
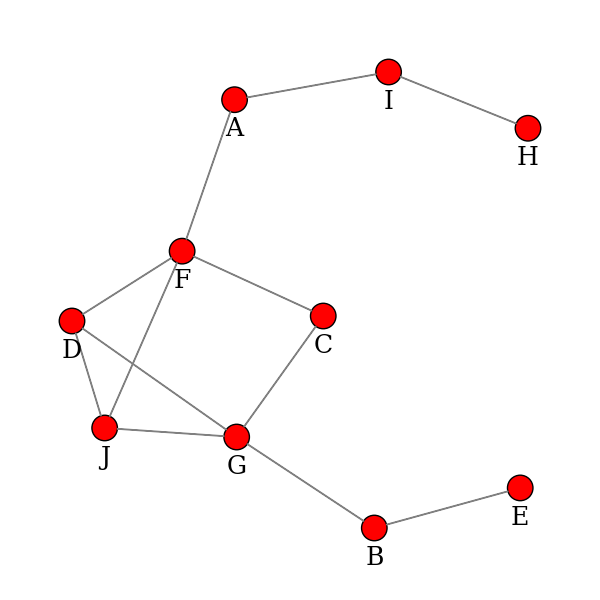
The labels of the vertices could be customized by the v_label argument. The v_label could be a list of strings. The labels of the vertices are the strings in the list.
For example, the following code shows how to customize the labels of the vertices of a graph.
If the v_label is not specified, no labels will be shown in the figure.
The font_size argument for dhg.Graph, dhg.DiGraph, and dhg.Hypergraph, as well as u_font_size and v_font_size for dhg.BiGraph is used to specify the relative size of the font of the labels, and the default value is 1.0.
The font_family argument is used to specify the font family of the labels, and the default value is 'sans-serif'.
>>> import matplotlib.pyplot as plt
>>> from dhg.random import graph_Gnm
>>> g = graph_Gnm(10, 12)
>>> labels = ['A', 'B', 'C', 'D', 'E', 'F', 'G', 'H', 'I', 'J']
>>> g.draw(v_label=labels, font_size=1.5, font_family='serif')
>>> plt.show()
Customize Colors
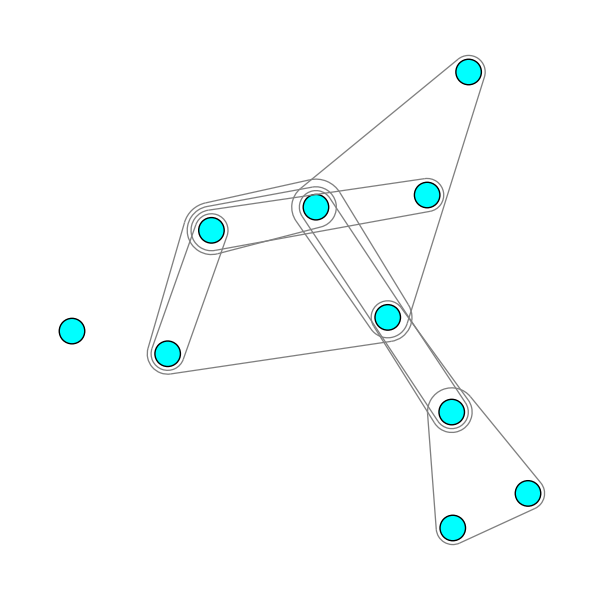
For dhg.Graph, dhg.DiGraph, and dhg.Hypergraph, the colors of the vertices could be customized by the v_color argument and the colors of the edges could be customized by the e_color argument. While for dhg.BiGraph, the colors of the vertices in \(\mathcal{U}\) could be customized by the u_color argument and the colors of the vertices in \(\mathcal{V}\) could be customized by the v_color argument. Both the v_color, u_color, and e_color could be a string or list of strings. If a string is provided, all the vertices or edges will be colored by the string. If a list of strings is provided, the colors of the vertices or edges are the strings in the list. For example, the following code shows how to customize the colors of the vertices and edges of a hypergraph.
>>> import matplotlib.pyplot as plt
>>> from dhg.random import hypergraph_Gnm
>>> hg = hypergraph_Gnm(10, 8, method='low_order_first')
>>> hg.draw(v_color='cyan', e_color='grey')
>>> plt.show()
Customize Sizes
For dhg.Graph, dhg.DiGraph, and dhg.Hypergraph, the sizes of the vertices could be customized by the v_size argument and the sizes of the edges could be customized by the e_size argument. While for dhg.BiGraph, the sizes of the vertices in \(\mathcal{U}\) could be customized by the u_size argument and the sizes of the vertices in \(\mathcal{V}\) could be customized by the v_size argument. Both the v_size, u_size, and e_size could be a float or list of float. If a float is provided, all the vertices or edges will be sized by the float. If a list of floats is provided, the sizes of the vertices or edges are the floats in the list. v_line_width represents the width of the surrounding line of the vertices. e_line_width represents the width of the line of the edges.
All of the sizes above represent the relative size, and the default values are 1.0. For example, the following code shows how to customize the sizes of the vertices and edges of a hypergraph.
>>> import matplotlib.pyplot as plt
>>> from dhg.random import graph_Gnm
>>> g = graph_Gnm(10, 12)
>>> g.draw(v_size=1.5, v_line_width=1.5, e_line_width=1.5)
>>> plt.show()

Customize Layout
The layout of the structures is based on the modified directed-force layout algorithm. There are four forces to determine the position of the nodes, i.e., node attraction force \(f_{na}\), node repulsion force \(f_{nr}\), edge repulsion force \(f_{er}\), and the center force \(f_c\). \(f_{na}\) is the spring force which attracts the adjacent nodes. \(f_{nr}\) is used to repel the nodes from each other. \(f_{er}\) is used to repel the hyperedges from each other, which only make sense for hypergraph visualization. \(f_c\) is used to attract the nodes to the center (two centers for the bipartite graphs).
The strength of the forces could be customized by forces argument, which is a dictionary with the keys Simulator.NODE_ATTRACTION, Simulator.NODE_REPULSION, Simulator.EDGE_REPULSION, and Simulator.CENTER_GRAVITY. The default values of the forces are 1.0.